Milton sits on the Niagara Escarpment's shadow, where over 132,000 residents now live on glacial till and shale bedrock. Every foundation here deals with the Halton Till—a dense mix of silt and clay with scattered stones. We run grain size analysis on every project because the gradation curve dictates drainage, frost susceptibility, and compaction behavior. A poorly graded sand reacts differently than a well-graded gravel under the same load. Our lab combines mechanical sieving from 75 mm down to 75 µm, then switches to hydrometer analysis per ASTM D7928 for the fines fraction. The full particle size distribution, from coarse gravel to colloidal clay, tells the real story of how water moves through the soil and how the ground will behave under freeze-thaw cycles common in Halton Region.
A grain size curve is the soil's fingerprint—miss the fines and you misjudge frost heave by an order of magnitude.
Service characteristics in Milton Ontario
Local geotechnical conditions in Milton Ontario
The Niagara Escarpment creates a microclimate where winter temperatures drop below -15°C while spring brings rapid snowmelt. A soil with more than 10% fines by hydrometer becomes frost-susceptible under Ontario Provincial Standard OPSS 1010. We've seen pavement heave on Milton residential streets where the gradation curve was assumed, not tested. Silt pockets within the till create perched water tables that saturate the subgrade during March thaw. The grain size analysis quantifies this risk precisely—clay content above 20% means low hydraulic conductivity and high frost heave potential. Coarse gravels drain freely but lose compaction strength if poorly graded. Each curve tells a different construction story, and missing the hydrometer portion leaves the most dangerous fraction completely unmeasured.
Our services
Our Milton laboratory runs the complete particle size distribution on every soil sample, from gravels to clays.
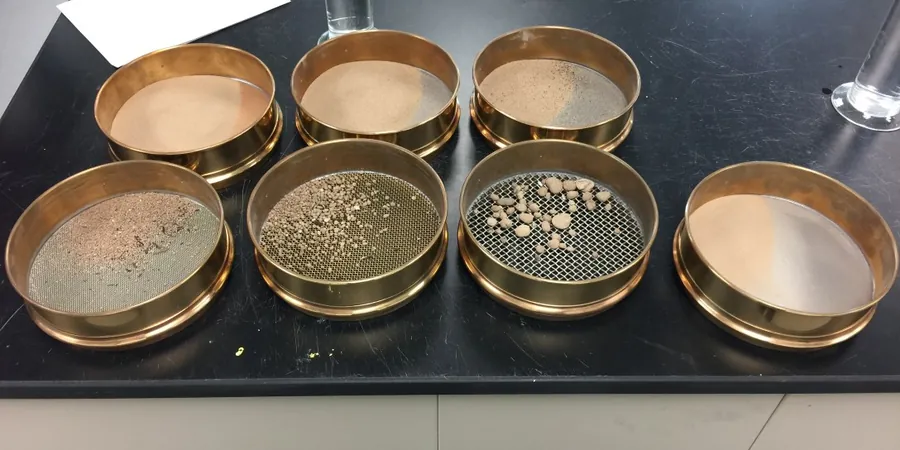
Sieve Analysis (Coarse + Fine)
Mechanical shaking through 75 mm to No. 200 sieves with wash procedure for particles down to 75 µm.
Hydrometer Sedimentation
ASTM D7928 hydrometer readings at 0.5, 1, 2, 5, 15, 30, 60, 250, and 1440 minutes for the silt-clay distribution.
Combined Gradation Reporting
Unified plot with USCS classification, Cu, Cc, and percent gravel-sand-silt-clay fractions for geotechnical submittals.
Frequently asked questions
What's the difference between a sieve-only and a combined sieve-hydrometer analysis?
Sieve-only stops at 75 µm (No. 200) and tells you the total fines percentage. The hydrometer goes further, measuring the silt and clay fractions separately by sedimentation rate. In Milton's Halton Till, that clay fraction often controls shear strength and frost susceptibility, so skipping the hydrometer misses critical data for foundation and pavement design.
How much does grain size analysis cost in Milton?
A standard combined sieve and hydrometer test runs CA$150 to CA$300 per sample, depending on whether we need the full hydrometer sedimentation series or just the fines fraction. Volume pricing applies for subdivision investigations with more than 10 samples.
How long does the hydrometer part take?
The sedimentation readings continue for a minimum of 24 hours, with measurements at prescribed intervals. Same-day results are not possible for the hydrometer portion—the clay fraction settles slowly by design. Combined with sieving, expect the final report in 2 to 3 working days.
Which ASTM standard applies to hydrometer testing?
We follow ASTM D7928 for the hydrometer method using an ASTM 152H hydrometer. The dispersion uses sodium hexametaphosphate at 40 grams per liter of solution. Temperature corrections are applied to all readings, and the sedimentation cylinder is kept in a controlled water bath at 20°C. More info.