Out here in Milton, you learn pretty quickly that the Niagara Escarpment doesn't mess around. You might be clearing what looks like a straightforward glacial till plain near Tremaine Road, only to hit a weathered shale ledge the excavator can't scratch. That's where seismic refraction and reflection tomography earn their keep. Rather than drilling blind through the Queenston or Georgian Bay formations, we map the velocity contrasts that tell you exactly where competent rock begins, where the fracture zones are hiding, and whether that "float" rock is actually a detached block sitting on a clay seam. The Halton Region's mix of red shale, grey limestone, and overlying Halton Till creates a layered velocity profile that's almost textbook for these methods—if you know how to read it right.
A 300 m/s velocity jump in the upper 10 metres isn't always bedrock in Milton—it can be a dense till lens that drills like concrete but weathers like soil.
Service characteristics in Milton Ontario
Demonstration video
Local geotechnical conditions in Milton Ontario
Milton's freeze-thaw cycles are brutal on near-surface rock, and that's something you can't ignore when interpreting a winter seismic survey. The upper 1.5 to 2 metres of shale that was solid bedrock in September can be a frost-jacked, cracked mess by February, dropping the apparent P-wave velocity by 40% or more. If you don't flag that in the processing—applying a near-surface static correction based on the frost penetration depth for that particular winter—you'll overestimate the rippability depth and potentially spec a hoe-ram where a large excavator would have sufficed. The other local headache is groundwater in the fractured rock aquifer; a saturated fracture zone at the shale-limestone contact will show up as a velocity inversion that the standard refraction interpretation (which assumes velocity increases with depth) completely misses. That's why we pair refraction with a short reflection spread whenever the water table is suspected inside the bedrock, so we don't hand the client a cross-section that says "competent rock" where there's actually a 2-metre-wide open joint flowing 50 gallons a minute.
Our services
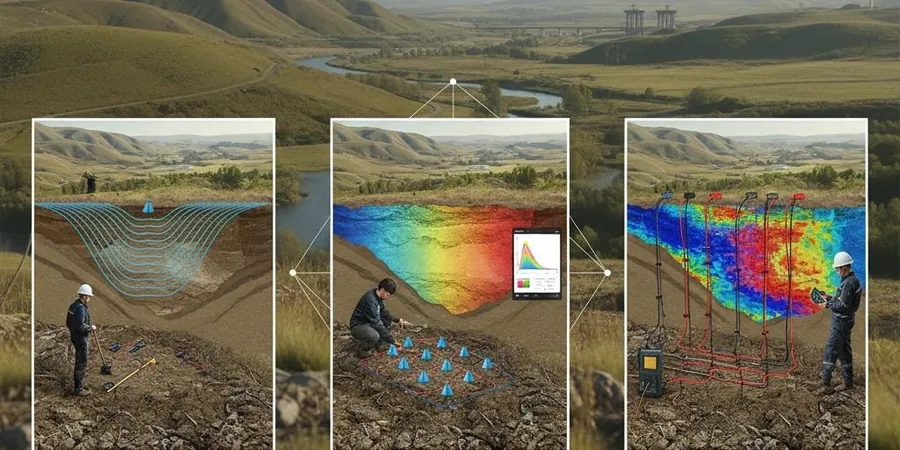
Every seismic survey we run around Milton gets tailored to the specific bedrock formation and the question the geotechnical engineer actually needs answered. These are the two core configurations we deploy most often across Halton Region sites.
P-Wave Refraction Tomography for Rippability and Bedrock Surface
This is the workhorse method for pre-excavation and foundation design in Milton. We lay out a 115- to 230-metre spread with 4.5 Hz vertical geophones, shoot from multiple offset positions to build a dense ray coverage, and invert the first-arrival traveltimes into a 2D velocity model. The output is a cross-section color-coded by P-wave velocity that the contractor uses to decide where the rock saw stops and the hydraulic breaker starts. We calibrate the velocity-to-rippability thresholds against Caterpillar D9/D10 performance charts, adjusted for the local observation that Queenston shale rips easier than its velocity suggests when the bedding planes are horizontal.
High-Resolution Reflection Profiling for Deep Bedrock and Paleovalley Mapping
When the question goes deeper than 30 metres—mapping the top of the competent limestone below a buried valley, or locating a suspected fault offset in the bedrock surface—we switch to a reflection setup with 28 Hz geophones and a higher-energy source. The processing workflow includes careful static corrections for the variable Halton Till thickness, deconvolution to tighten the wavelet, and post-stack time migration. For Milton sites near the Escarpment, we pay extra attention to removing the steep-dip reflections off the exposed rock face that can alias into the section if the line orientation isn't chosen carefully.
Frequently asked questions
What kind of bedrock will seismic tomography find on a typical Milton lot—and how deep is it usually?
Across most of Milton, the bedrock is either the Queenston Formation (red shale with thin siltstone beds) or the overlying Georgian Bay Formation (grey-blue shale and limestone interbeds), capped by 3 to 15 metres of Halton Till. In the north near the Escarpment, bedrock can outcrop at surface; south of the 401, overburden depths of 15 to 25 metres are common. Seismic refraction will clearly image the top of competent rock and any major fracture zones within the upper 20 to 35 metres, while reflection can push that image down past 100 metres if you need to see the full stratigraphic column.
How much does a seismic refraction or reflection survey cost in the Milton area?
For a typical 115-metre refraction spread with multiple shot points, interpreted and delivered as a velocity cross-section with a technical memo, budgets in Milton tend to fall between CA$3,620 and CA$6,120. The spread depends on line length, number of shots, whether we're running both P-wave and S-wave, and how much traffic control or farmer-access coordination is required. A reflection survey with the accelerated weight drop and full processing will sit at the upper end of that range. We provide a fixed-price proposal after reviewing the site plan and the target depth, so there are no surprises.
Can seismic methods tell the difference between a dense till boulder bed and actual bedrock?
They can, but it takes careful interpretation. A boulder bed or a dense basal till lens in Milton can produce P-wave velocities in the 1,800–2,400 m/s range, which overlaps with the low end of weathered shale. The giveaway is usually the velocity gradient: real bedrock will show a sharp increase to 2,800+ m/s within a few metres of the refractor, while a till lens plateaus and then drops back down. We also look at the S-wave data when there's ambiguity—till has a much lower Poisson's ratio than shale, so the P-to-S velocity ratio separates them cleanly.
Do you need a lot of open space to run a seismic line—what if the site is tight or has houses close by?
A standard refraction spread needs about 115 metres of clear ground for a 30-metre depth target, but we've run lines in some pretty awkward Milton infill lots by shooting end-on into a geophone spread laid along a laneway or property edge. Reflection requires a bit more room because the near-offset mute removes shallow data, but we can work with as little as 60 metres if the target is deep enough. The sledgehammer source doesn't generate complaints from neighbours the way a shotgun or explosives would, and we coordinate access with adjacent property owners when the line extends beyond the subject parcel.